
Living Threat Repository: what it’s for, where everything is, and how to use it
brings three things together in one place: the report library (Documents), the ATT&CK map (Navigator), and the actions/workflow (Attack Path + Hunt Pack). Once you know what each area is for, it becomes much easier to use.

The platform brings three things into one screen:
- a report library (Documents)
- an ATT&CK map (Navigator)
- an action workflow (Attack Path + Hunt Pack)
Once you know what each area is for, it becomes straightforward.
The purpose
Security teams don’t lack information. They lack a fast way to turn information into action.
This platform takes many threat articles and incident reports and turns them into a structured evidence view mapped to MITRE ATT&CK, so you can quickly answer:
What happened? → How did it happen? → What should I check / detect / do next?
Use cases
Rapid triage (find what matters fast)
You filter by time and severity, then use priorities to surface the most important items first.
This saves you from reading 30 reports to find the 1 that matters.
Hunt and detection acceleration (turn reading into action)
You pick one report, the platform highlights its techniques, then Attack Path + Hunt Pack give you checks, detections, and remediation ideas.
Team alignment (shared story)
Everyone looks at the same techniques, the same evidence, and the same filtered view. Less back-and-forth, fewer misunderstandings.
Where everything is on the page
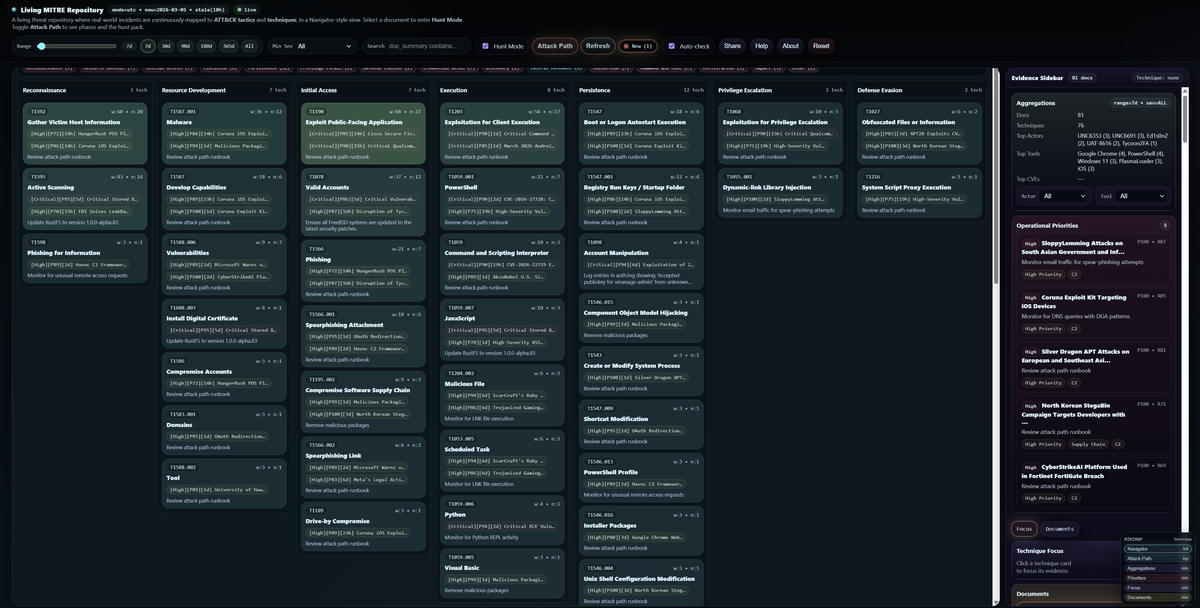
Top control bar (very top of the page)
This is where you set your scope and control the workflow:
- Search (left side of the bar): keyword filter (quick narrowing)
- Range (slider + presets like 7d/30d/90d/All): time window
- Min Sev (dropdown): minimum severity threshold
- Hunt Mode (toggle): highlights techniques related to the selected document
- Attack Path (button): opens the stage-by-stage view for the selected document
- Refresh (button): reloads the latest dataset
- Auto-check (toggle): checks if new docs arrived (shows a “New” badge)
- Share (button): copies a link to your current view
- Help / About (buttons): quick guide + background
- Reset (button): clears everything back to defaults
Tip: Press Ctrl+K to open the quick switcher (jump to a document fast). Press / to jump into search.
Navigator panel (big left panel)
This is your ATT&CK map.
- Techniques are grouped into tactic columns.
- Clicking a technique card fills the “Technique Focus” details on the right.
- If you select a document and enable Hunt Mode, techniques from that document get highlighted.
Evidence Sidebar (right panel)
This is where you work with the evidence and the controls around it. Inside the right panel you’ll see these sections (top to bottom):
- Selected Doc box (appears after you pick a document)
Shows the chosen report and quick actions like Open / Attack Path / Clear. - Aggregations box
Filters like Actor, Tool, Country, Sector, Software, Access Vector, etc.
Use this when you want “only things related to X”. - Operational Priorities box
A short list of the highest-priority items for your current filters.
Clicking one selects that document for you. - Documents list
This is your library of reports that match your filters.
On desktop, it’s in the right panel under the Documents tab.
On mobile, use the Docs button in the top bar to open the Documents drawer. - Technique Focus
When you click a technique in the Navigator, this section shows why it matters and which docs support it.
There’s also a small mini map (bottom-right) that jumps you to key sections quickly.
How to use it (simple workflow for beginners)
Start with scope (top bar)
- Set Range to 7d or 30d
- Set Min Sev to Moderate+ or High+
- Use Search if you’re focused on a specific vendor/product/incident keyword
Pick your starting evidence (right panel)
You have two easy options:
- Click something in Operational Priorities (fastest)
- Or open the Documents list and pick a report that looks relevant
Once you pick a document, you’ll see the Selected Doc box appear in the right panel.
Highlight what matters (Navigator)
Make sure Hunt Mode is ON in the top bar.
Now the Navigator will visually highlight techniques connected to your selected report.
Understand the story (Attack Path)
Click Attack Path in the top bar (it becomes active only after you select a document).
This shows the incident as phases/stages, not just scattered techniques.
Inside the Attack Path strip, use:
- Show Hunt Pack (button) to open the actionable section
- Pin/Unpin if you want it fixed while you scroll
Take action (Hunt Pack)
Hunt Pack is where you “do the work”:
- Checks Now: what to look for today
- Detection / Remediation notes: what to detect or fix next
- Pivots (actor/tool/CVE buttons): click them to filter the entire dataset and explore related reports
A sample workflow
If you want to use it like a SOC analyst:
- Set Range = 30d, Min Sev = High+
- Pick the top item in Operational Priorities
- Confirm it by opening it from the Selected Doc box
- Click Attack Path and read the stages you see
- In Hunt Pack, pick 2–3 “Checks Now” items and translate them into “where would I check this?”
EDR telemetry, Windows event logs, SIEM searches, firewall/proxy logs, cloud audit logs, etc.


